Loaders timeline
Overview
By clicking on the "Compile Analysis" -> "Loader Analysis" option in the navigation bar of Rsdoctor, we can see the execution timeline of all loaders in the current project. Please note that this page requires the loader analysis capability to be enabled in order to display the features. The content of this page is shown in the following image:
Glossary
The fields in the chart on the page have the following meanings:
Usage
In the Loaders Timeline, the left Y-axis represents the loader names, while the top X-axis corresponds to time (hour:minute:second). We can use the zoom feature and hover over the chart to view more detailed information about loader invocations.
There are two selector at the top of the page, where you can enter the Loaders or Files you want to filter, and the timeline chart will be displayed based on the filtered content.
Viewing overall loader information
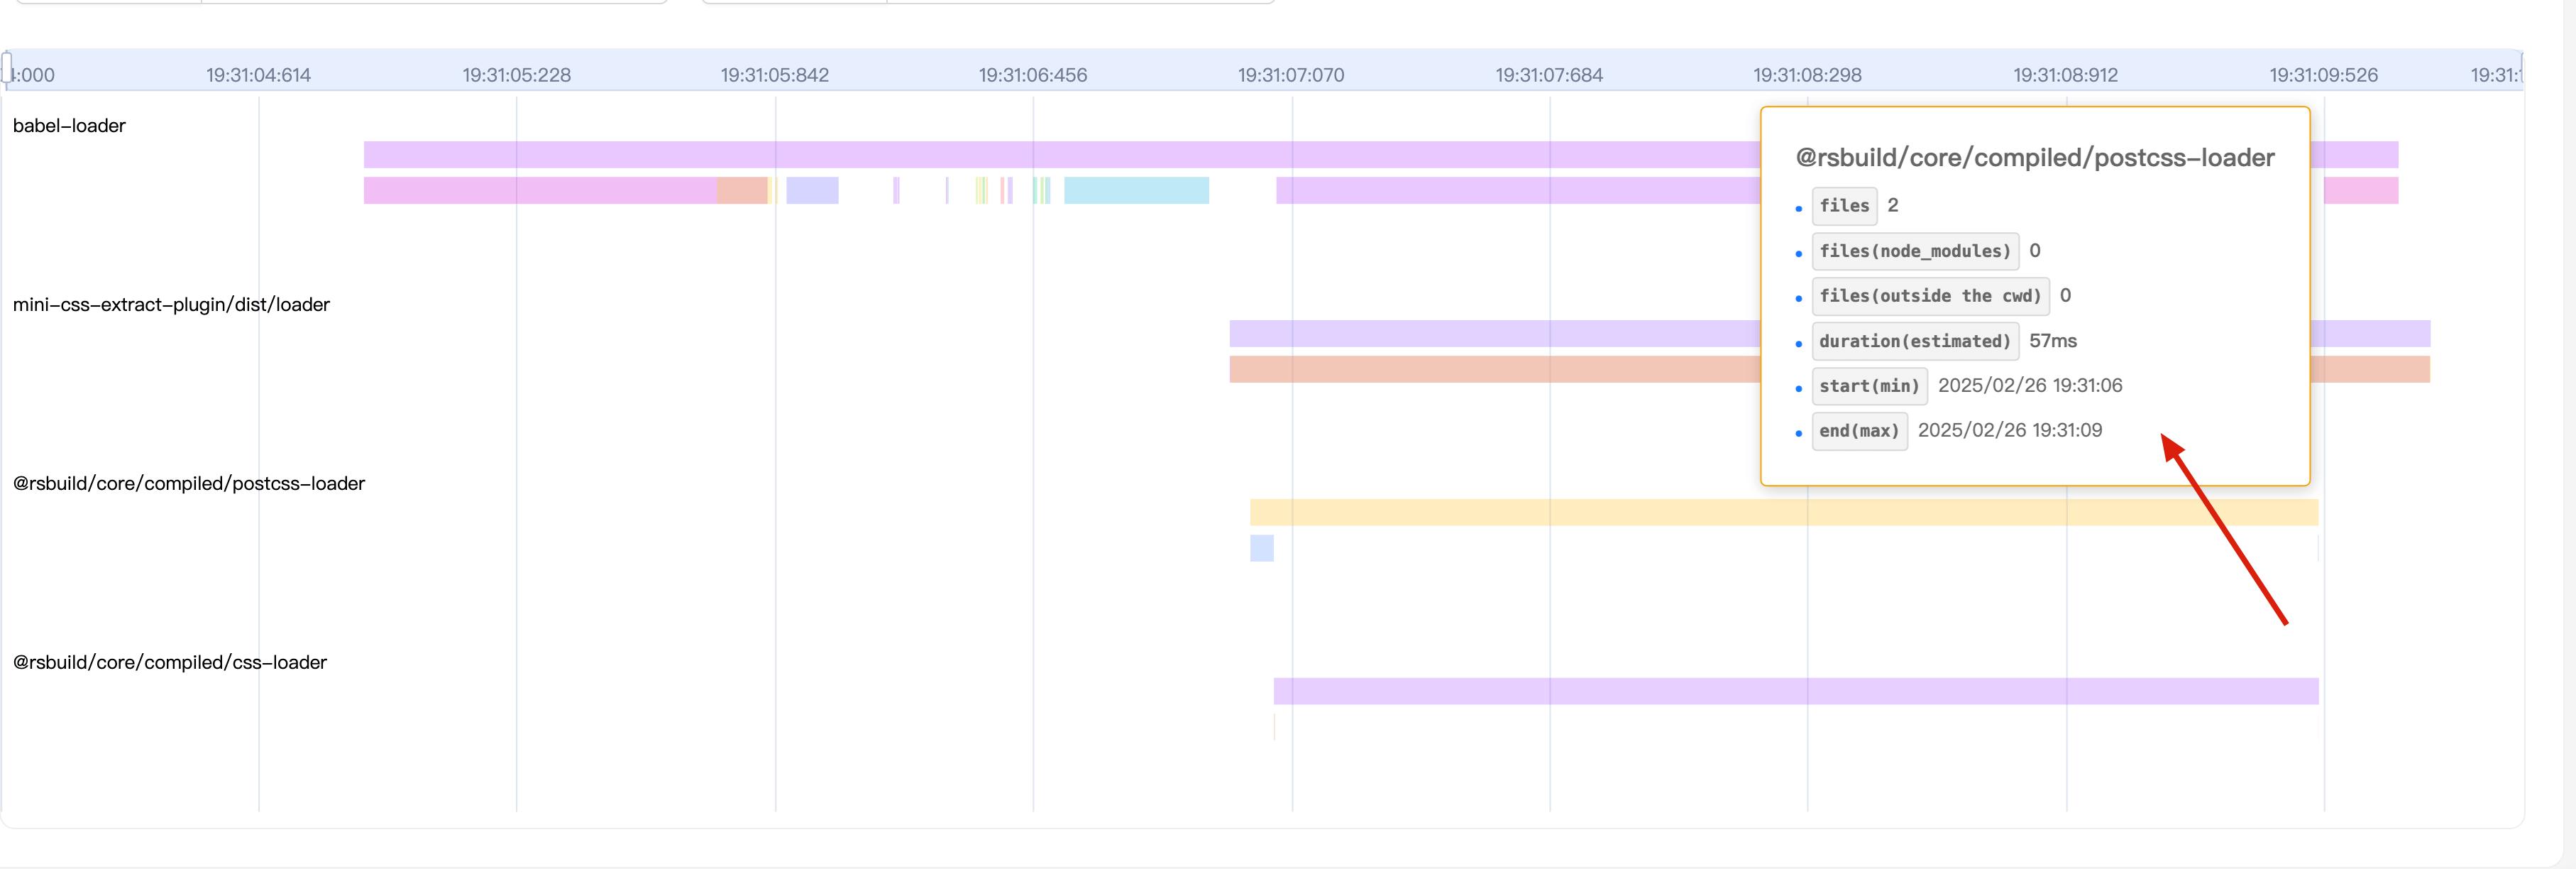
If we want to view the summary of all data for a single loader, we can hover over the position shown in the following image:
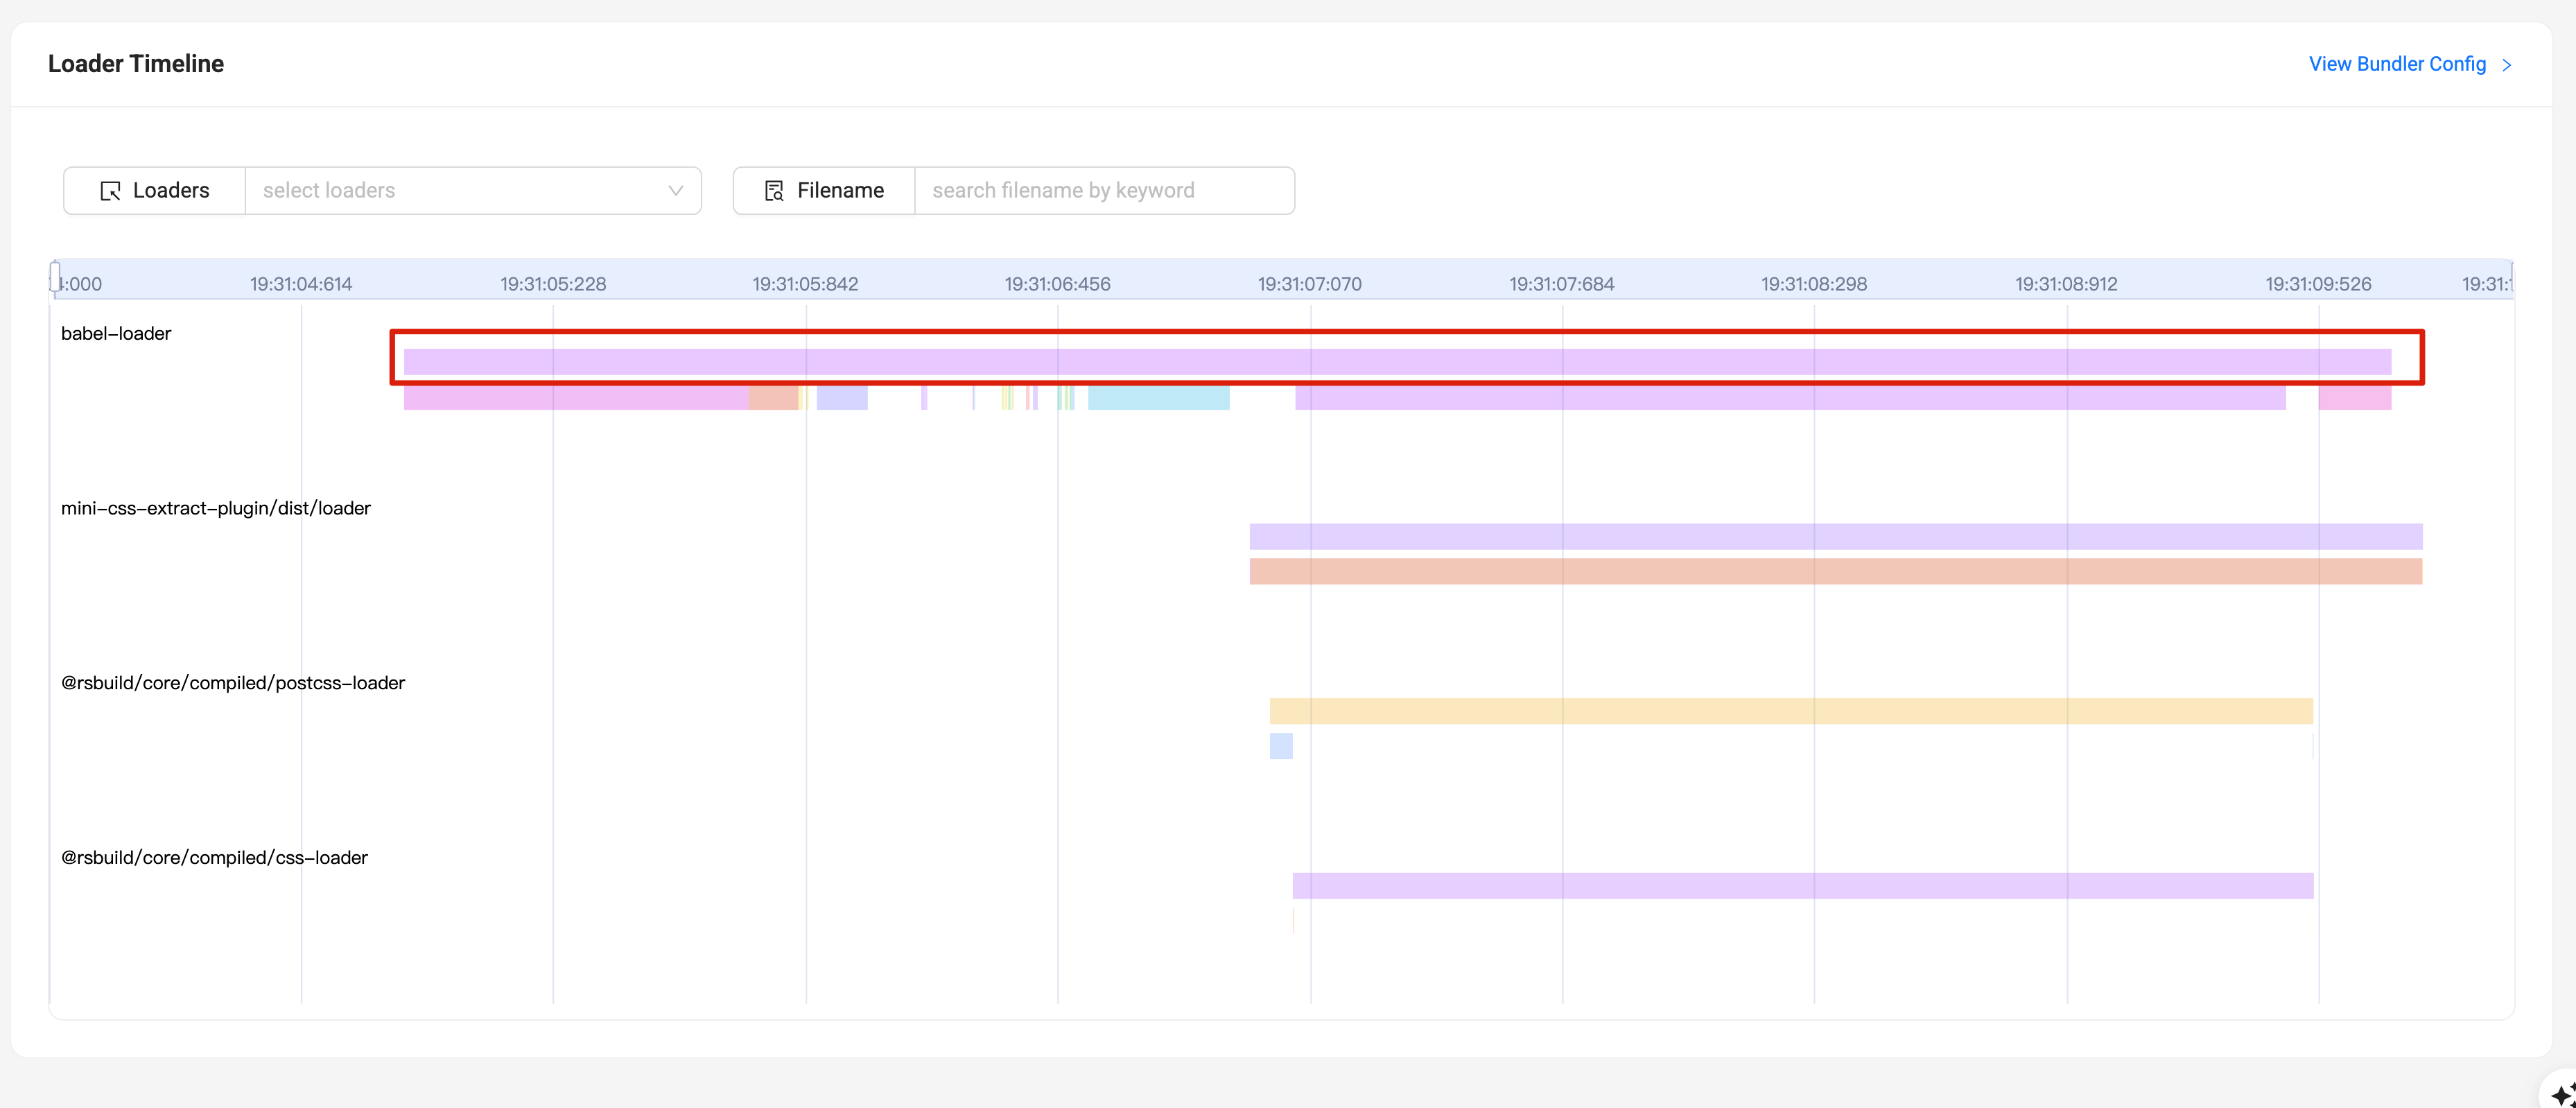
At this point, we can see the summary of all invocations within a single loader (refer to the Glossary for field definitions), as shown in the following image:
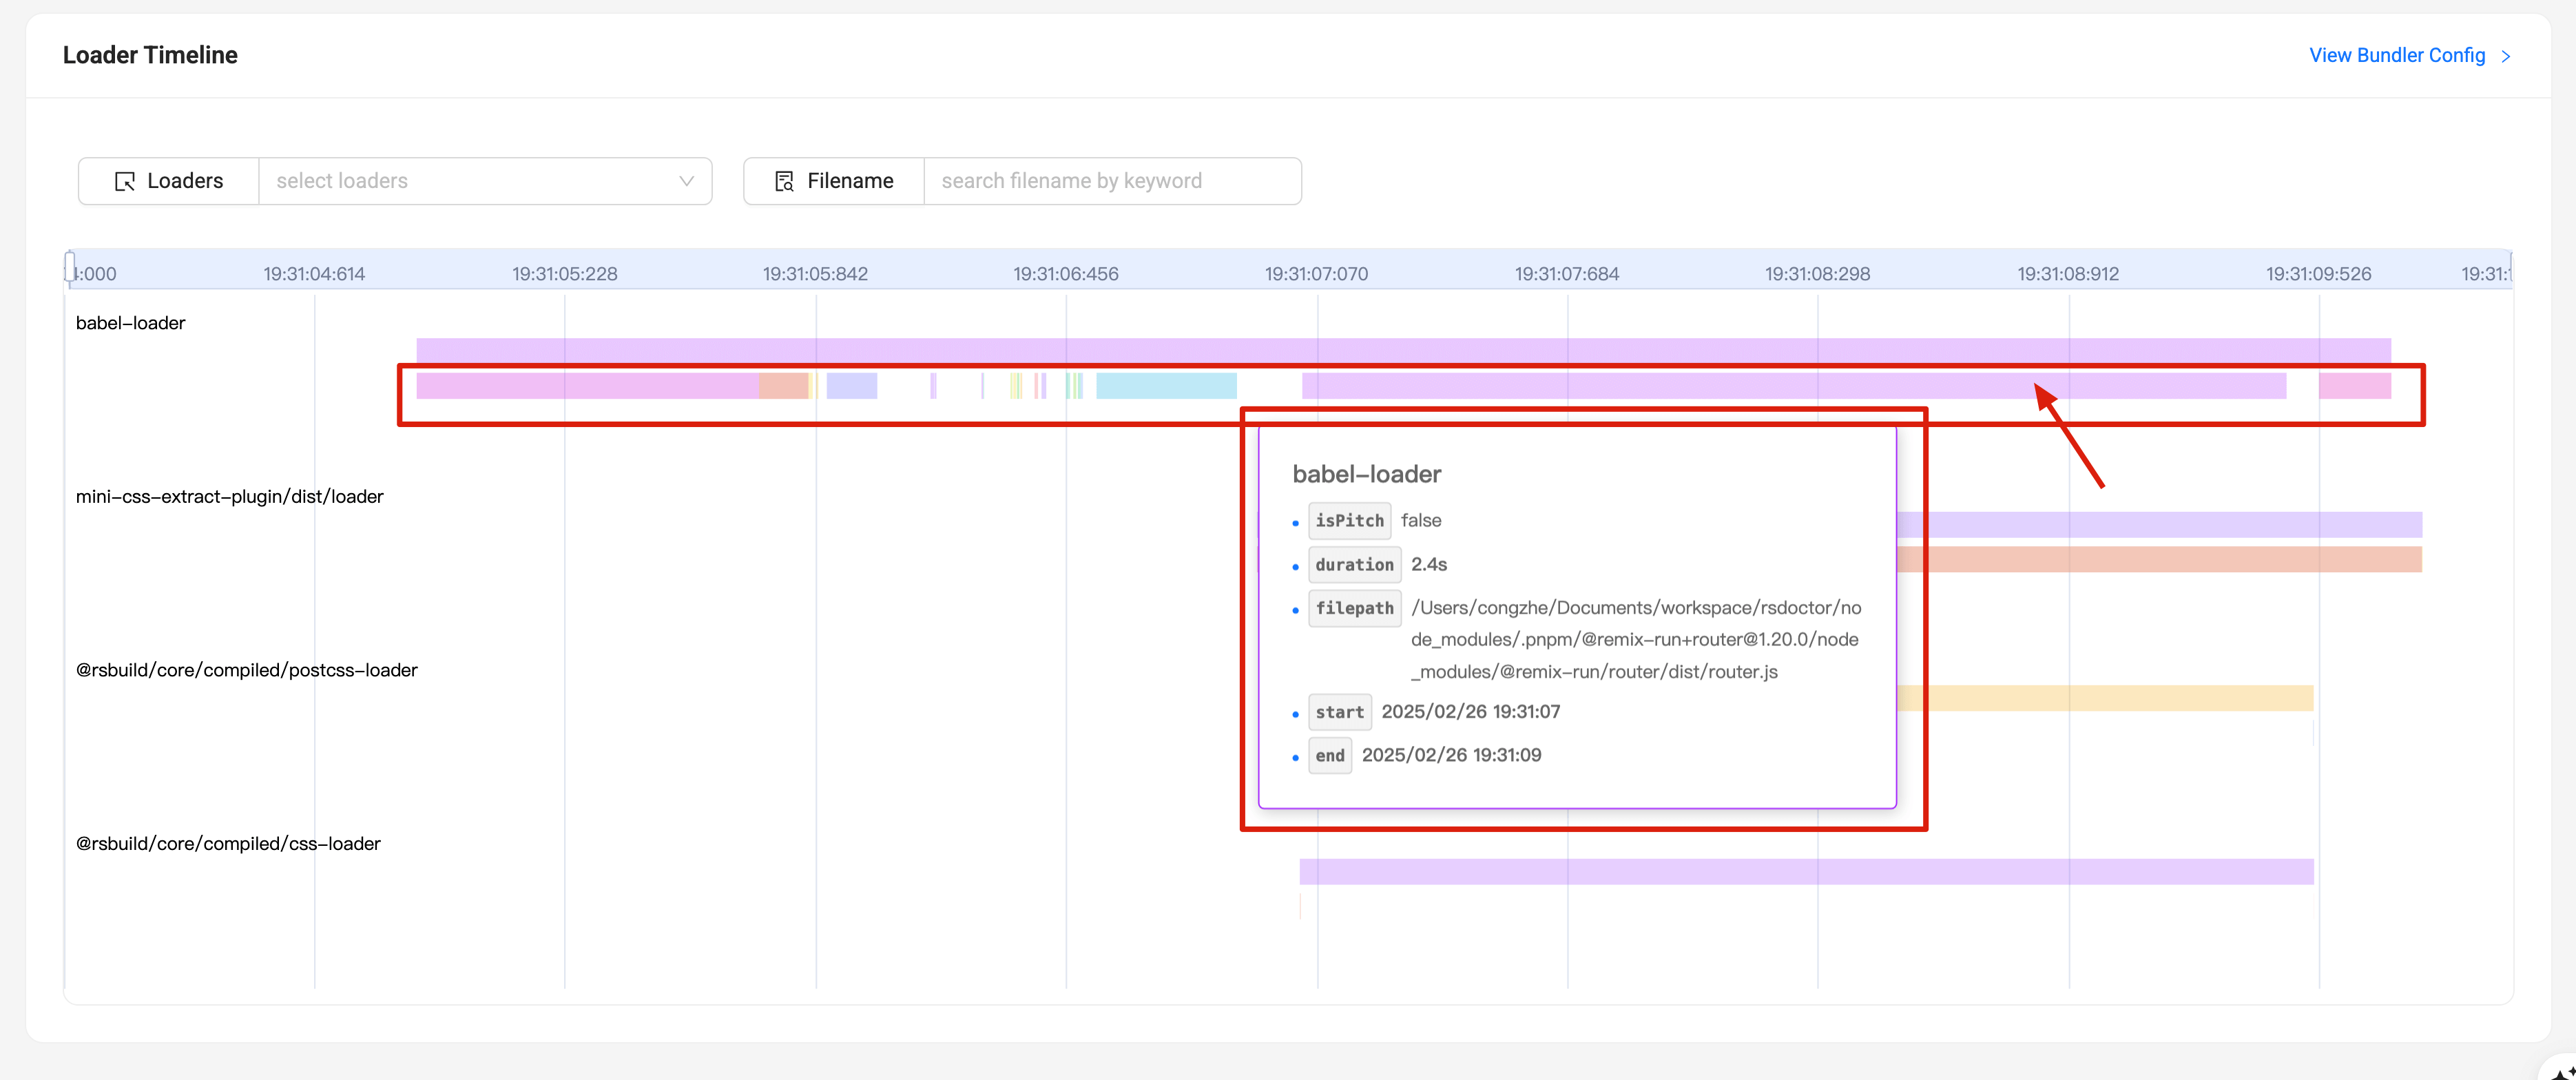
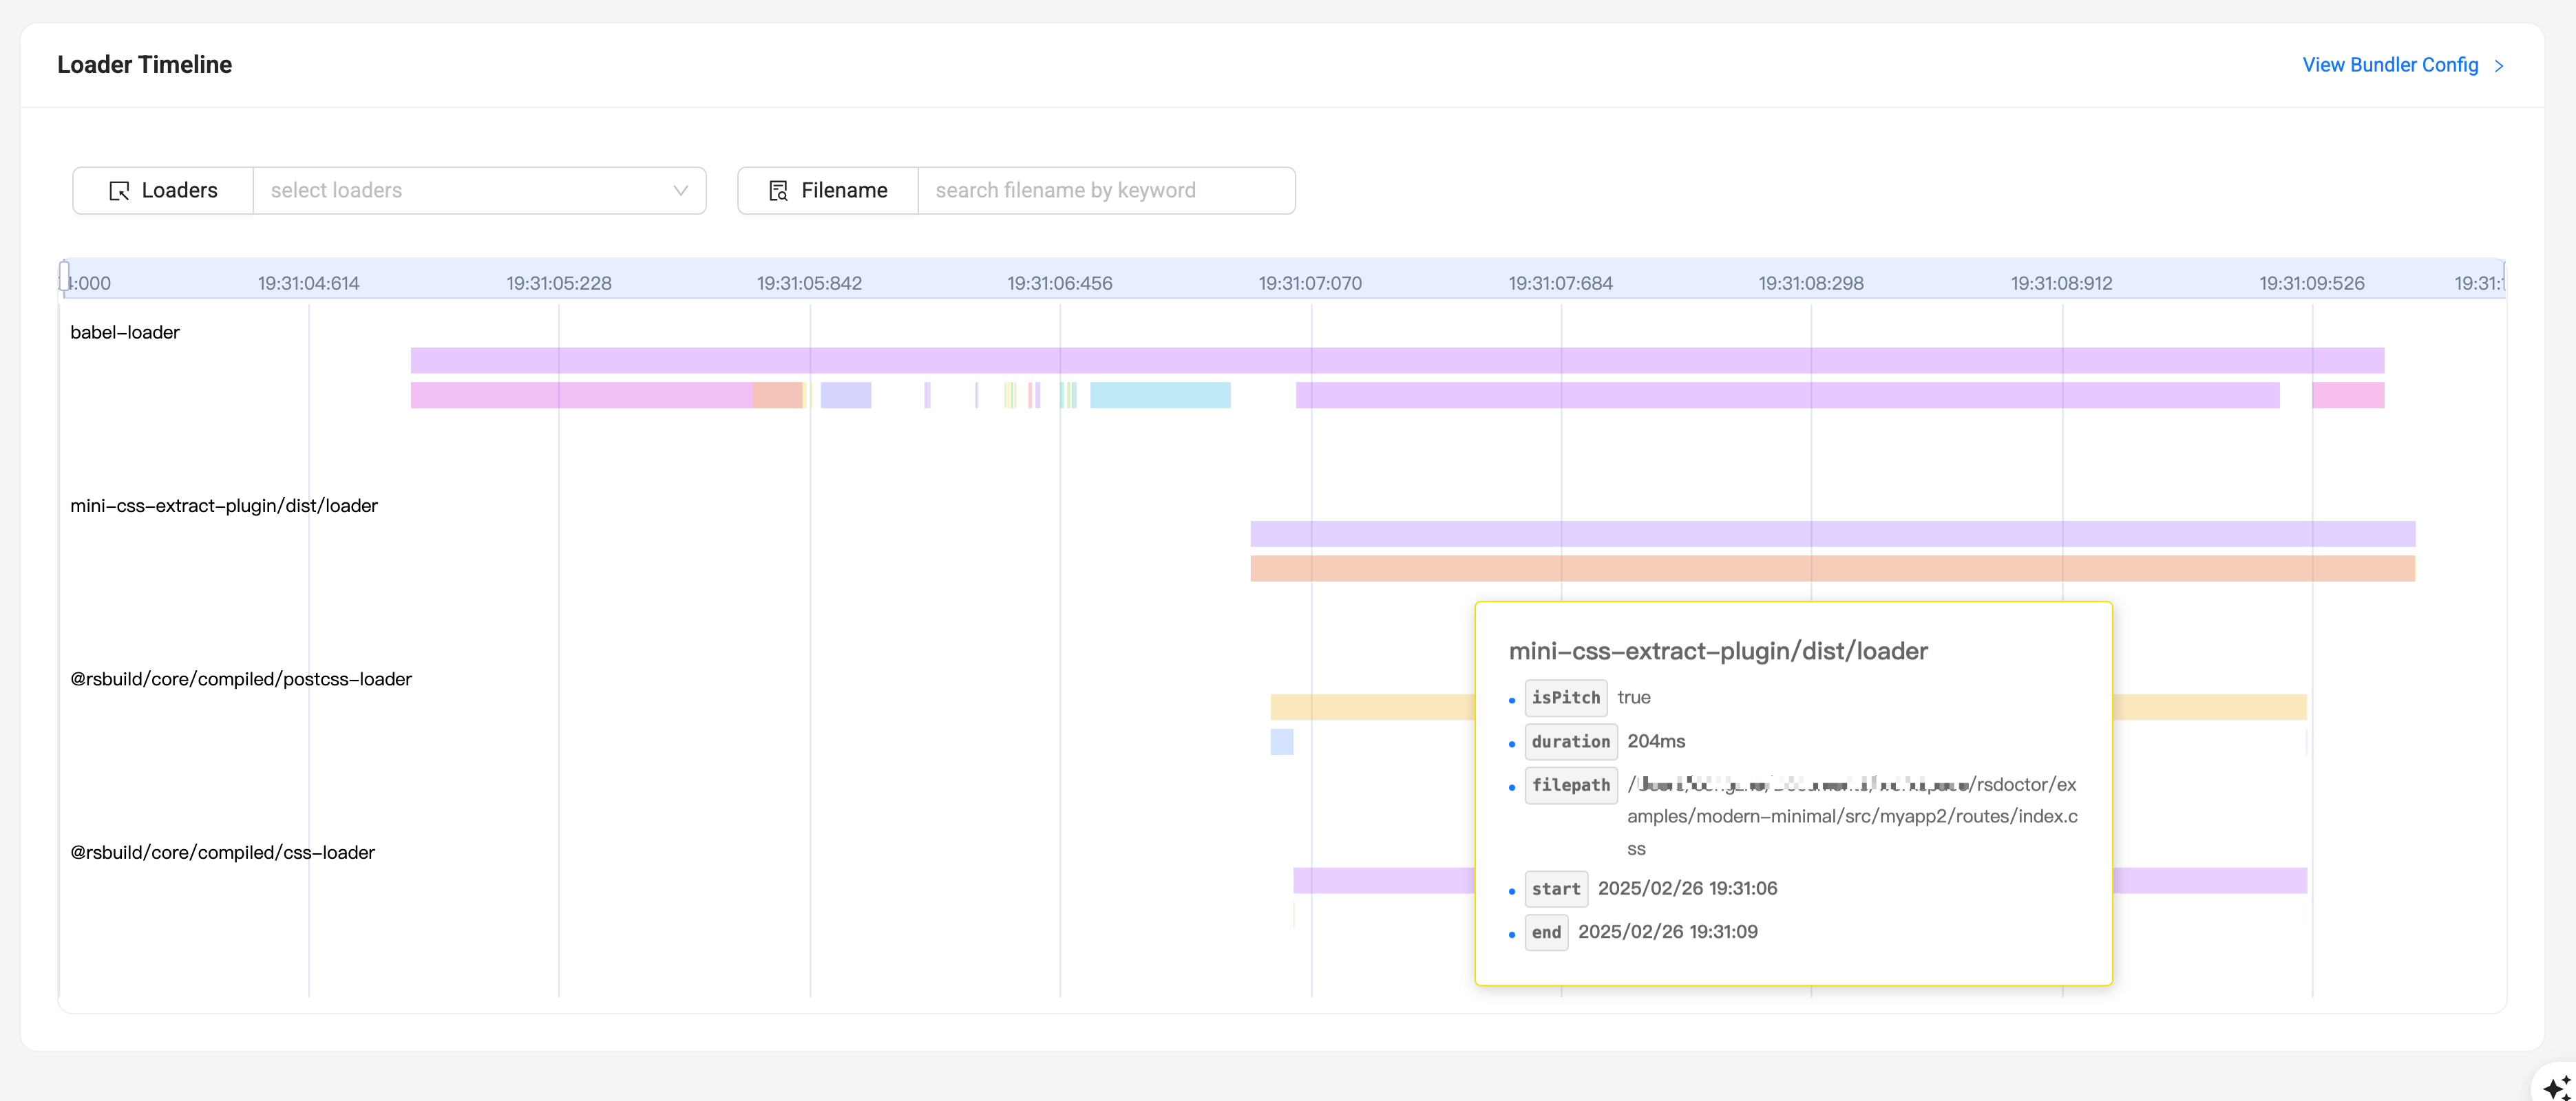
Viewing individual loader invocation information
If we want to view the information of a single invocation for a loader, we can hover over any colored stripe within the position shown in the following image. At this point, we can see the information of the current invocation within a single loader (refer to the Glossary for field definitions), as shown in the following image: